
DATA ACQUISITION SYSTEMS
SIGNAL CONDITIONING
The dynamic range of high-quality measurement accelerometers and microphones has for many years been significantly better than that of the analog signal conditioning electronics and analog-to-digital converters (ADCS) of the data acquisition systems. This is despite the fact that data acquisition systems today are typically based on 24-bit ADCS, and theoretically able to handle signal dynamics of up to 144 dB.
In practice, however, most of these ADCS does not have a useful dynamic range higher than 110 – 115 dB. Consequently, great care must be exercised in optimizing the analysis chain dynamics to the output of the transducer, in order to avoid overload and under-range situations.
This article describes some of the analysis chain imperfections that are present in data acquisition systems and how a high dynamic operating range can be achieved, in a single input range, using state-of-the-art designs.
Dynamic Range, Operating Range, and Frequency Bandwidth
The ratio between the highest and lowest signal a system can measure overall is defined as the dynamic operating range of the system. The ratio between the highest signal a system can measure in a given input range and the system base noise for the same input range is defined as the dynamic range of the system for the given input range. If the dynamic range is too low, then high signals will be clipped and distorted while low signals will be buried in system noise.
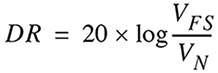
In technical terms, the dynamic range (DR) is the ratio between the RMS value of a full-scale sine wave VFS and the RMS value of the system base noise VN . It is typically given in dB:
When discussing dynamic range, the frequency bandwidth of the measurement must be taken into consideration. In a well-designed system, the inherent system noise can be characterized as white noise.
Consequently, if all elements of the measurement chain are linear in nature, the dynamic range of the measurement can be improved by reducing the measurement frequency bandwidth. This is actually one of the advantages of the commonly used FFT analysis. For this statement to be valid, it is essential that no artifacts are introduced in either the time domain or the frequency domain, when performing narrow band analysis.
TRANSDUCERS
Dynamic Range of Transducers
Before the Dyn-X technology was introduced in 2005, the sound and vibration transducers have outperformed the subsequent analysis systems as regards linearity and dynamic performance.
A high-quality transducer, including a preamplifier, can deliver a practical noise-, spurious- and distortion-free signal over a dynamic range of 120 to 130 dB using broadband, and 160 dB using narrowband analysis. In a well-designed transducer, the limiting factors for achieving a high dynamic range are mainly the noise floor and the clipping level of the preamplifiers electronics.
The transducer element itself does not limit the performance. The noise floor VN of a high-quality preamplifier has for the last 40 to 50 years been in the region of 3 µV to 15 µV in the audible frequency range and the maximum linear output VFS of a DeltaTron®/ICP® transducer is 5 VRMS (7.071 Vpeak). Table 1 provides examples of dynamic ranges that can be expected for a high-quality transducer.
Throughout this article, a bandwidth of 25.6 kHz is used for broadband comparisons. For narrowband comparisons 24 Hz, 6 Hz, and 1Hz are used, where, for example, 6Hz corresponds to the effective noise bandwidth of a 25.6 kHz FFT analysis with 6400 lines using Hanning weighting [1]. So, a high-quality transducer can be used for narrowband measurements over a dynamic range of 160 dB (effective noise bandwidth 6 Hz) given that no other factors affect the measurement chain.
| Bandwidth (Hz) | 25600 | 1024 | 24 | 6 | 1 |
|---|---|---|---|---|---|
| VFS (VRMS) | 5 | ||||
| VN (VRMS) | 3u | 600n | 92n | 46n | 19n |
| DR (dB) | 124 | 138 | 155 | 161 | 169 |
Analysis Chain Imperfections
The clipping level and the noise floor are not the only factors limiting the useful dynamic range of the analysis system. The list below includes some other factors that limit the analysis system performance.
- Harmonic Distortion: Signals caused by non-linearities in the analog signal conditioning. Typically characterized as a family of harmonic components, where the levels are determined relative to the measurement signal.
- Cross-talk: Signals caused by inter-channel coupling, where the levels are determined relative to the signal level of the originating channel.
- Spurious: Signals caused by various phenomena such as power supply imperfections, clock circuits, bus communication, and EMC coupling between circuits.
- ADC Resolution: The ADC resolution is given by the number of bits N as 2N.
- ADC Nonlinearity: Digital distortion components caused by uneven quantization step sizes in the ADC.
- Aliasing: Signal artifacts originating from signal components of frequencies higher than the Nyquist frequency, where the levels are determined relative to the measurement signal.
- DSP Imperfections: Modern analysis systems perform filtering, decimation, and the actual analysis in the digital domain. Throughout the whole digital analysis chain, a high dynamic range requires high-speed calculations of high accuracy. High-speed DSPs are both expensive and have high power consumption.
System Considerations
No system is better than the weakest link in its chain. The analysis chain consists of coupled elements each with a limited dynamic range as illustrated in Fig. 1.
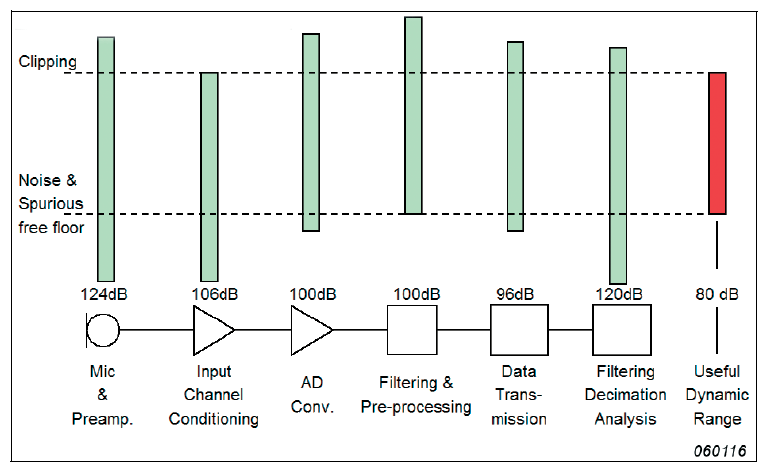
The ADC has been the weakest link in the analysis chain ever since the invention of digital signal processing. New ADC designs have, however, improved performance dramatically.
Table 2 gives a rough overview of the historical evolution in ADC specifications for sound and vibration analysis. Traditional ADC designs still lack performance when compared to the transducer (Table 1).
| Year | ADC Resolution (bits) | Dynamic Range (DC - Fs/2) [dB] |
|---|---|---|
| 1970 | 10 - 12 | 60 dB |
| 1980 | 14 - 16 | 70 dB |
| 1990 | 16 | 80 dB |
| 2000 | 24 | 100 dB |
| 2005 | 24 | 110 dB |
Overcoming the Analysis Chain Imperfections
The fact that the transducer has historically always outperformed the subsequent elements of the analysis chain with respect to dynamic range, has been compensated for by the inclusion of an input attenuator in the analysis chain.
This has, in practice, compensated for the limited dynamic range of the ADC and also the limitations in the following DSP chain by increasing the dynamic operating range. The drawback is, however, quite a high risk of bad measurements as overload and under-range situations can occur (Fig. 2).
LEARN MORE
SOUND PRESSURE
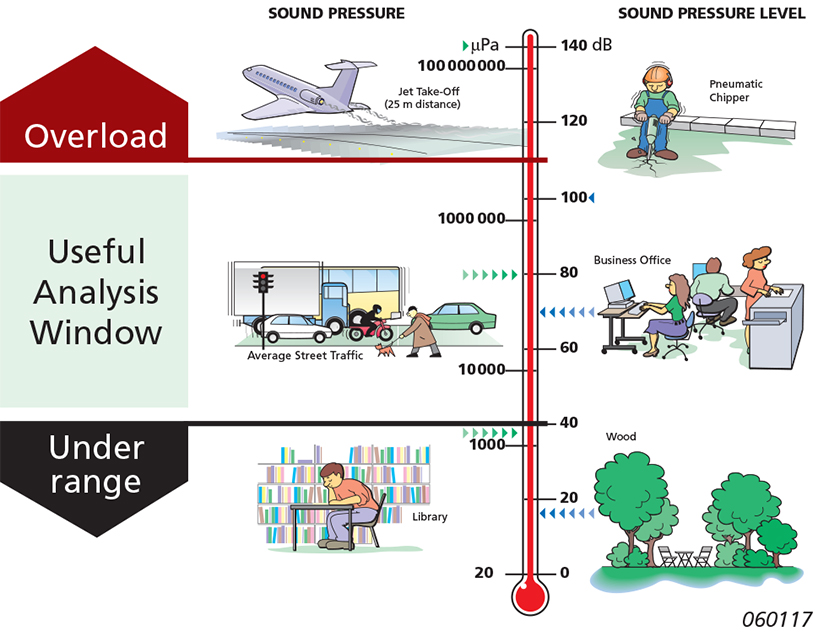
An overloaded measurement is erroneous and has to be re-measured. There is no way of estimating the correct result. Overloads are probably the greatest cause of bad measurement results. This issue is even more critical in multi-channel and/or multi-analysis measurements, as it is more difficult to get an overview of the whole measurement scenario and avoid erroneous measurements.
Theoretical Dynamic Range of a 24-bit System
An approach similar to the one applied to the transducer can be applied to the system with respect to broadband and narrowband analysis. The theoretical dynamic range in dB can be calculated as [2]:
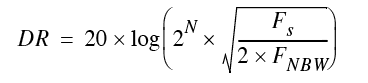
N is the system quantization in bits, FS is the sampling frequency, and FNBW the effective narrowband analysis bandwidth in Hz. Careful system design can ensure that the quantisation noise is, theoretically, random and thus with a uniform spectral density (white). Under this assumption, the theoretical dynamic range in dB can be calculated as [3]:
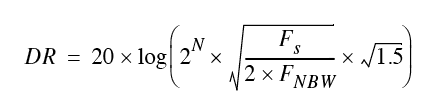
This gives an increased dynamic range of approximately 1.8 dB compared to equation (2). Using equation (2) table 3 shows the dynamic range in different bandwidths as a function of system quantization.
| N (bits) | Resolution | Dynamic Range | ||||
|---|---|---|---|---|---|---|
| FNBW (Hz) | ||||||
| 32768 | 1024 | 24 | 6 | 1 | ||
| 16 | 65 536 | 96 | 111 | 128 | 134 | 141 |
| 20 | 1 048 576 | 120 | 135 | 152 | 158 | 166 |
| 24 | 16 777 216 | 144 | 160 | 176 | 182 | 190 |
Using equation (2) or equation (3), the theoretical increase in dynamic range ⍙DR can be expressed as a ratio between the sampling frequency Fs and the width of the narrowband analysis FNBW [2]:

| FNBW (Hz) | 1 024 | 24 | 6 | 1 |
| DR (dB) | 15 | 31 | 37 | 45 |
Narrowband analysis can improve the dynamic range quite dramatically and an ideal 24-bit system can fully match the performance of modern transducers.
Dyn-X Technology
The above discussion shows that if the ADC performance can be significantly improved in combination with a careful design of the whole analysis chain, then the problematic input ranging can be eliminated. Brüel & Kjær have researched this over the years and have introduced in 2005 a new technology designed to increase the dynamic performance of the whole analysis chain sufficiently to eliminate the use of input attenuators.
The new technology is called Dyn-X. The technology utilizes a specialized analog input design to provide a very high dynamic range of the analog circuit, pre-conditioning the transducer signal before feeding it to the ADC. The Dyn-X input channels have no input attenuators, but a single input range from 0 to 10 Vpeak.
The digitizing is performed synchronously in two specially selected, high-quality, 24-bit delta-sigma ADCs, and both data streams are fed to the DSP environment where dedicated algorithms in real-time merge the signals while obtaining an extremely high-accuracy match in gain, offset and phase.
An important requirement of the design process was that no technical drawbacks must be introduced in either the time or the frequency domain with respect to distortion and other artifacts when compared to existing designs (Fig. 3).
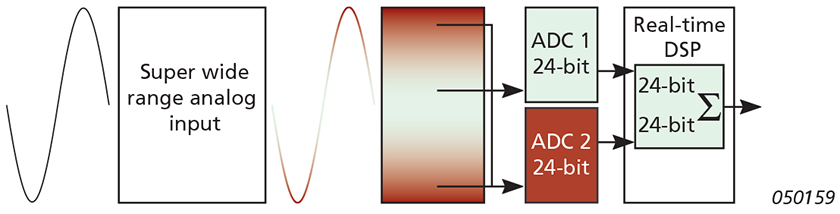
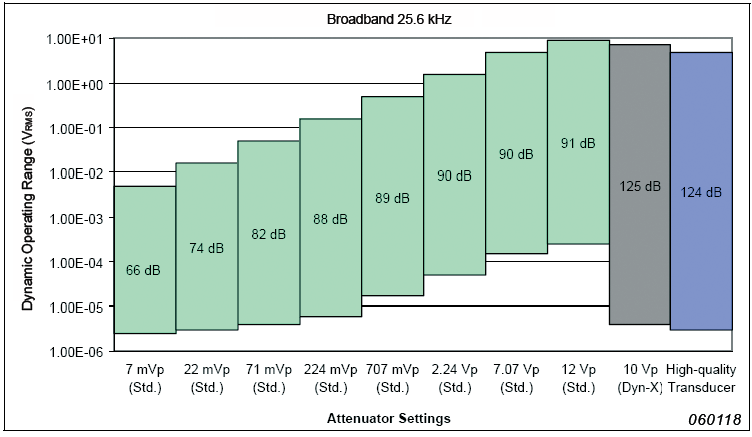
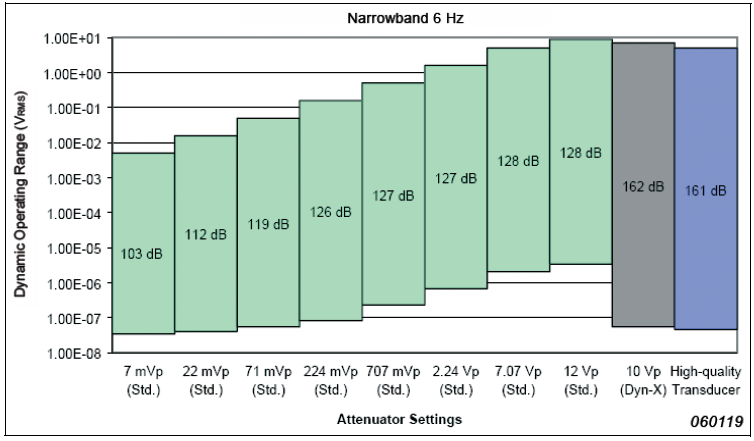
Fig. 4 and Fig. 5 compare the dynamic performance of a standard high-quality 24-bit input channel with the Dyn-X input channel. In Fig. 4, a 25.6 kHz bandwidth is used.
In Fig. 5, a 6 Hz bandwidth is used – corresponding to what would be achieved using a 25.6 kHz FFT analysis, with 6400 lines and Hanning weighting. It can be seen that the Dyn-X input channel covers practically the same range as the 8 input attenuator settings of the standard 24-bit input channel and that the dynamic operating range of the Dyn-X input channel matches that of a high-quality transducer. The dynamic ranges are calculated using guaranteed noise levels.
LAN-XI DAQ
Dyn-X Technology Performance
It has previously been mentioned that the whole chain must have a dynamic operating range better than 124 dB for a 25.6 kHz broadband analysis, and correspondingly better than 160 dB for a 6Hz narrowband analysis, in order to match the specifications of high-quality transducers.
The following examples compare the performance of the Dyn-X input channel to a standard 24-bit input channel. Note that the standard channel when set to a lower input range can, in theory, provide measurements of similar quality, but with a high risk of generating overloads. The maximum input is 7VRMS (10Vpeak) for the Dyn-X input channel and 5VRMS (7Vpeak) for the standard 24-bit input channel.
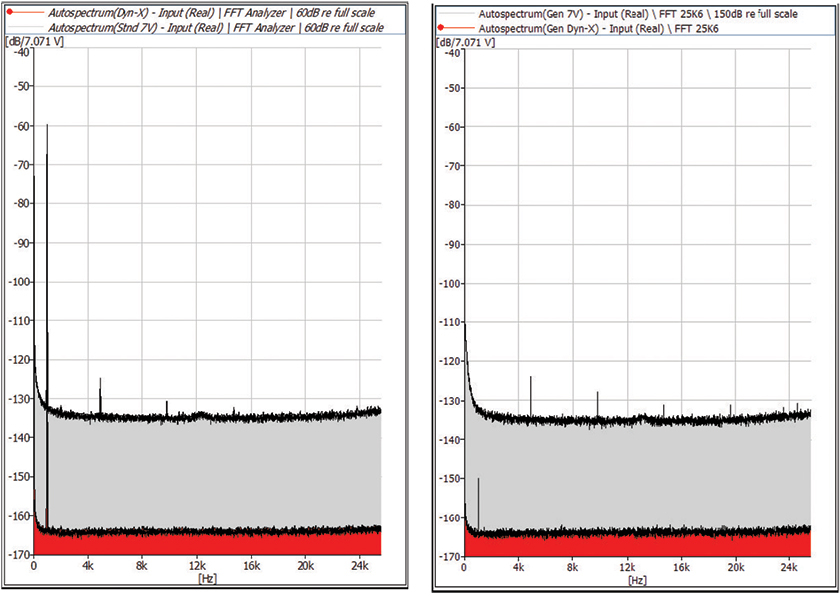
In Fig. 6 (left) the two channels are compared for a 1 kHz sine wave attenuated 60 dB (re. 7V) corresponding to a signal level of 7 mVRMS. FFT analysis in 25.6 kHz, 6400 lines, and Hanning weighting was used resulting in an effective noise bandwidth of 6 Hz. For the Dyn-X input channel noise and spurious components are below –160 dB, thus matching the performance of high-quality transducers. The noise floor of the standard 24-bit input channel is approx. 30 dB higher and distortion components are clearly visible indicating non-linearity in the ADC.
In Fig. 6 (right), a similar comparison is done, but now with the sine wave attenuated 150 dB (re. 7V) corresponding to a signal level of 0.22 µVRMS. The noise floor and the spurious components are below –160 dB for the Dyn-X input channel and the sine wave is easily detected. For the standard 24-bit input channel, the sine wave is buried in noise. Noise and distortion components from ADC nonlinearity are clearly visible in the standard channel.
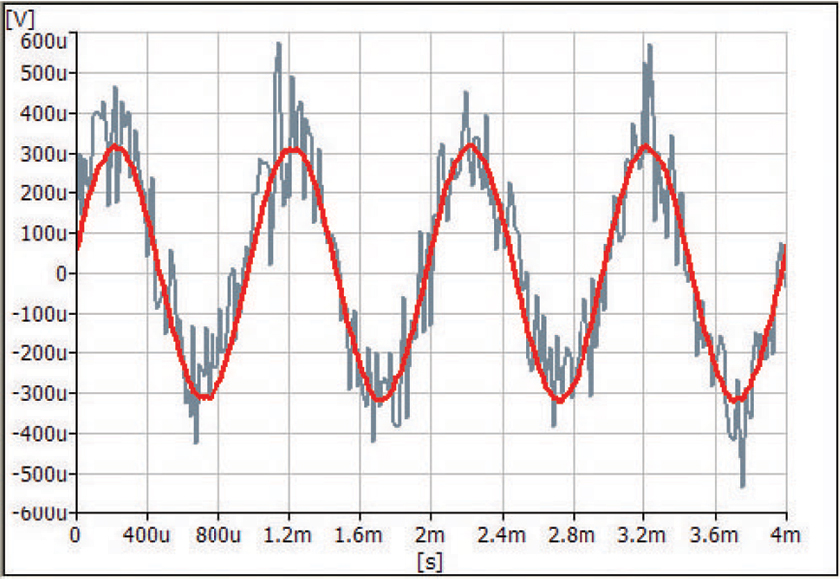
In Fig. 7 the two channels are compared in the time domain for a 1 kHz sine wave attenuated 90 dB (re. 7V) corresponding to a signal level of 0.22 mVRMS. Again noise and distortion components are clearly visible in the standard 24-bit input channel.
In Fig. 8, a microphone measurement example is shown. The measurement is performed in a standard office environment with background speech and a person whistling. FFT analysis is used in 25.6 kHz with 1600 lines giving a frequency resolution of 16 Hz. The microphone signal is measured by both channels in parallel.
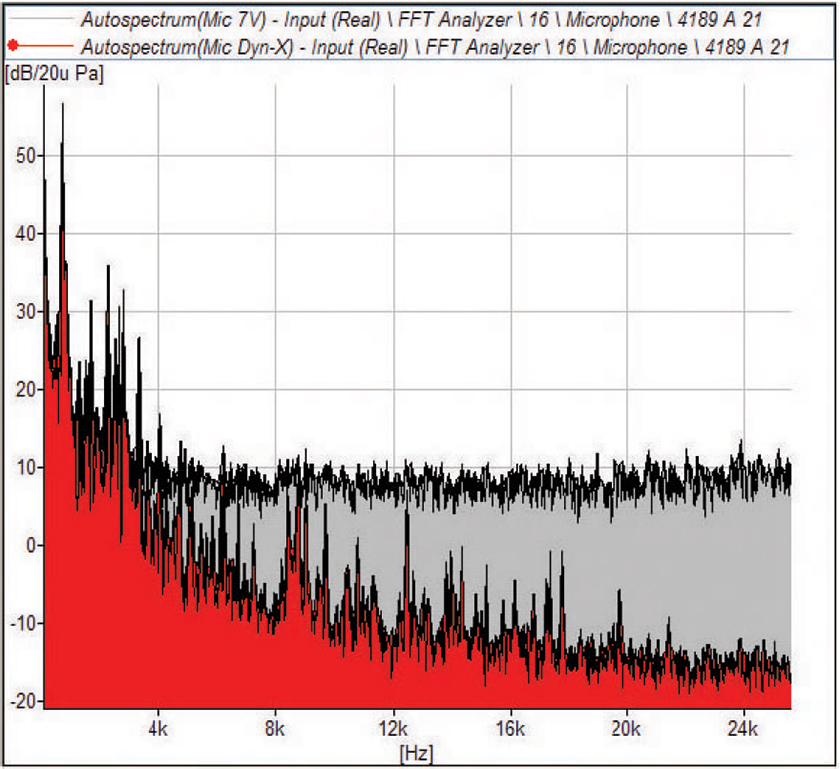
This simple measurement clearly illustrates the improved dynamics of the Dyn-X input channel when compared to the standard 24-bit input channel. The difference is close to 30 dB above 4 kHz. The standard 24-bit input channel measures system noise instead of environmental office noise.
Benefits of Dyn-X
With no setting of input ranges, and with no need to be concerned about overloads, under-range measurements, and the accuracy of the measurements obtained, the ease and safety of performing sound and vibration measurements are dramatically increased using Dyn-X input modules. And with no need for trial runs to ensure correct input ranges for the various input channels, the certainty of getting the measurements right the first time is also significantly increased.
Dyn-X is a technology that can be usefully employed in a number of measurement situations and applications as shown in Table 5. Using a standard input module with input attenuators would in most cases, be impractical, and in some cases, even impossible.
|
When the measurement must be right the first time ● Crash testing ● Destructive testing ● Heavy Machinery – run up/coast down |
When signal levels are unknown ● Run up/down ● Field testing ● Troubleshooting ● Monitoring |
|
When time is limited ● Test cells ● Wind tunnels ● Road testing ● Flight testing |
When performing high-dynamic applications ● Structural measurements ● Run up/down ● Impulsive testing, room acoustics ● Electroacoustics |
|
When user interaction is minimal ● Road testing ● Flight testing ● Untrained operator |
When it is difficult to get an overview of the whole measurement scenario ● Multi-channel measurements ● Multi-analysis measurements ● Test cells ● In-car testing ● Sound, vibration, and other parameters involved |
|
When testing is unattended ● Monitoring ● Production line testing |
Conclusions
Before the introduction of Dyn-X in 2005, high-quality transducers have outperformed analysis systems with respect to linearity and dynamic performance.
Several weak links in the analysis chain have reduced the resulting analysis performance and an input attenuator has been required to accommodate the dynamic range of the transducer. This increases the risk of overload and under-range situations and it forces the user to constantly pay attention to the measurement status.
24-bit ADCs are today industry standard and are in theory able to handle the full dynamic range of high-quality transducers without the inclusion of an input attenuator. However, until the introduction of Dyn-X, no commercial ADCs have had sufficient performance to allow for the elimination of the input attenuator. With the introduction of the innovative Dyn-X technology, a significant performance increase has been achieved in both analog conditioning and digital signal processing.
As demonstrated with measurement examples, the Dyn-X technology matches the high dynamic performance of high-quality transducers, thereby totally eliminating the need for input attenuators. Consequently, measurements become safer, a higher measurement quality can be achieved and the operator does not constantly have to pay attention to the actual signal levels to avoid overload and under-range situations.
AUTHORS
Ole Thorhauge, Application Engineer at Hottinger Brüel & Kjær.
Areas of work include multichannel data acquisition front-ends and the subsequent storage of measurement data in multi-user databases.
Niels-Jørgen Jacobsen, Product Manager for Structural Dynamic at Hottinger Brüel & Kjær.
As a former application engineer, he has specialized in structural dynamics, machine diagnostics, and industrial acoustics.