BK CONNECT TYPE 8405-G
Sound Quality Metrics
For characterizing product sound quality this software is designed to quantifying acoustic emissions in terms of how humans respond to them, by recording data for post-processing
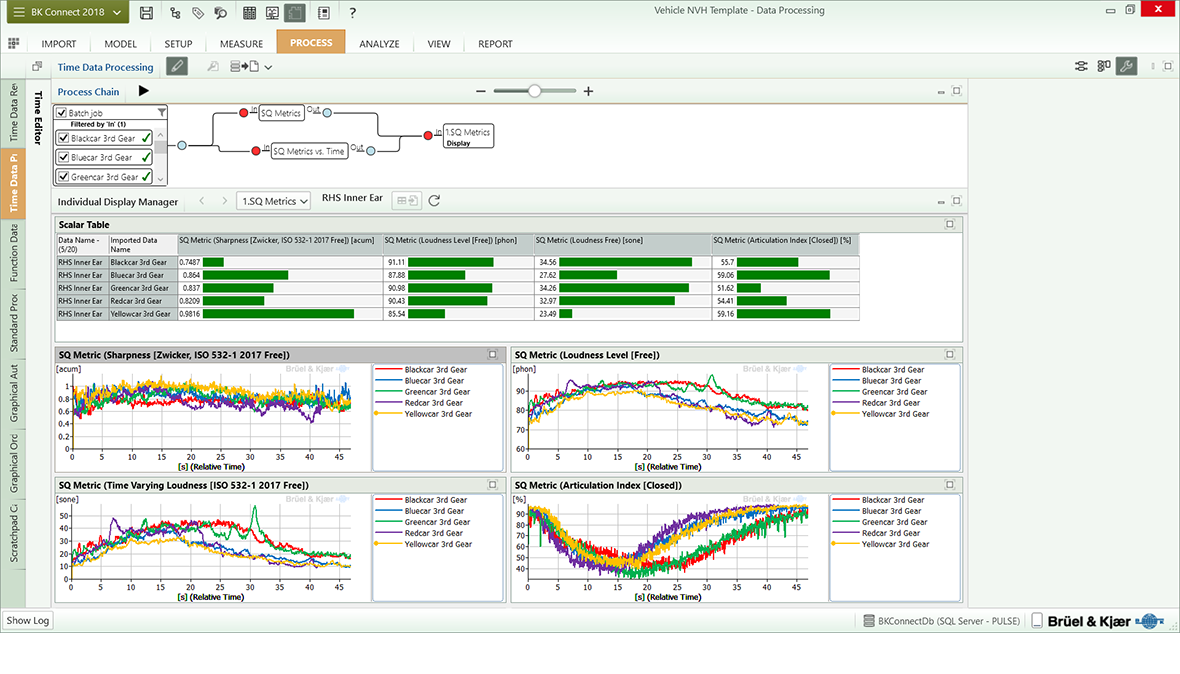
Richiedi un preventivoThis BK Connect® option analyses product sound quality using parameters that closely relate to the complete human experience of the sound, rather than using purely physical quantities such as sound pressure. The software can analyze recorded measurements using sound quality metrics such as ‘loudness’. Users can filter the sound using these sound quality parameters, to deliver engineering targets and understand the value of potential changes.
USE SCENARIOS
- Post-recording analysis and editing
- Batch processing of multiple sound recordings
- Benchmarking comparisons of competitor and current products
- Heavy machinery development and evaluation
- Speech intelligibility evaluation
- Noise annoyance investigations
SOUND QUALITY VS SOUND PRESSURE
Conventional, physical sound analysis deals with sound in the air. Sound quality metrics measure the effects our ears have on the sound before it reaches our brains, such as favouring certain frequencies. Sound quality metrics also measure how our mental processes determine how the sound affects us. Some metrics such as Zwicker Loudness attempt to understand how the human ear experiences sounds by properly weighting the different parts of the sound signal. Other metrics like articulation index quantify factors such as how easy it is to hold a conversation near the sound source. By using combinations of such objective sound quality metrics to describe the outcomes of these complex psychoacoustic phenomena, you can reliably quantify them in a repeatable way that gives clear engineering directions.
RESULTS
You can view analysis results in terms of sound quality metrics such as ‘roughness’ or ‘sharpness’, alongside the conventional units such as sound pressure level. At the same time, the sounds can be played back, while viewing their spectral content in a spectrogram display. The user can also select just the valid sections of the time history.
CAPABILITIES
- Incorporation of sound quality metric calculations into standard sound and vibration analyses
- Concurrent spectral and overall broadband analysis with metric calculations
- Correlation of subjective evaluations with objective metrics
- Comparisons of multiple products
SOUND QUALITY METRICS
- ISO 532-1 2917 stationary loudness, loudness percentiles, loudness level
- DIN 45631 time-varying loudness
- DIN 45631/A1
- Binaural loudness – Robinson and Whittle, Moore-Glasberg
- DIN 45692 sharpness
- Fluctuation strength
- Roughness
- Articulation Index
- Tone-to-noise ratio – ANSI S1.13
- Prominence ratio – ANSI S1.13
- Tonality – Terhardt
CHARACTERISTICS
- Graphical, drag-and-drop analysis process chain
All BK Connect analyses use a graphical process-chain concept for setting up the post-recording analysis process. This includes individual elements for filtering, analysis, display and storage of results. each is individually configurable. Process chains can be exported to a file and emailed to allow others to repeat a defined, standardized process. - Automated processing
To maximize productivity, BK Connect enables batch processing of sequenced or parallel analysis of multiple sets of imported data. Time data can also be automatically imported from a network drive, and you even have the option of automatic reporting.
REQUIREMENTS

Iscriviti alla nostra Newsletter e ricevi le informazioni più recenti dal mondo del suoni e delle vibrazioni

