The magnitude of vibration exposure depends on several factors, for example, driving speed, the engine’s RPM, the type of tires and tire pressure, and the road conditions. It also depends on the way you sit on the motorbike and grip the handlebars. Vibration transmitted through handlebars and footrests seems to cause the most problems.
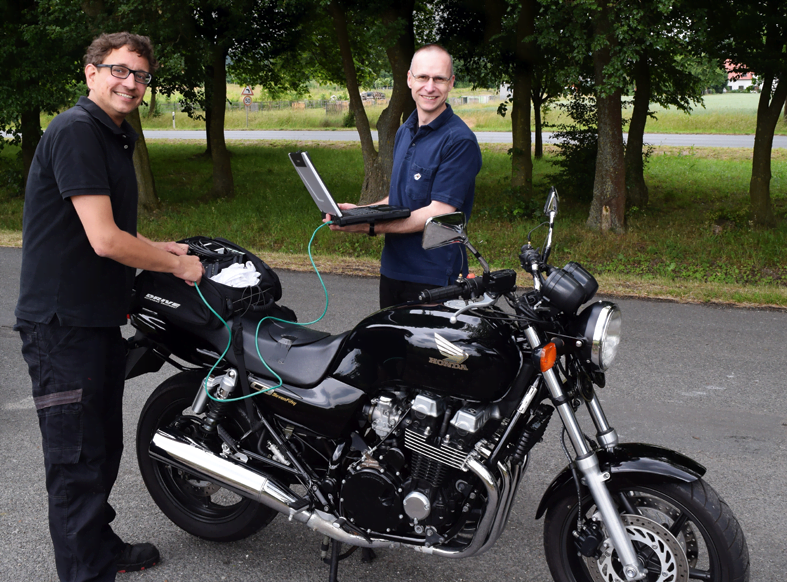
Prof. Adamek (right) and Dipl. Wirt.-Ing. Marcus Schröter (left) preparing measurement setup
An EU Directive provides limits for vibrations experienced by people who ride motorbikes as part of their profession. These values can also be used as guidance for non-work-related riding. The Directive states that exceeding these limits over an extended period can negatively affect health, resulting in, for example, vascular or muscular disorders. In addition, overall performance can be influenced, increasing the risk of accidents.
Measuring over 2500 km on 27 bikes
Professor Adamek from the University of Applied Sciences Osnabrück, Campus Lingen in Germany took on the challenge to determine the vibration exposure to motorbike riders and recently published an impressive research project. Vibration was measured over a total of 2500 km, driven on 27 bikes, with 23 different drivers.
The research looked at people who ride motorbikes for their profession (using police motorbikes and the St. John’s accident assistance motorbikes) and for private use. The goal was to quantify the exposure to vibration while riding and to develop the order of magnitude of this exposure depending on motorbike types for different riders.
In the past, a number of studies have looked at vibration and motorbikes but none of these have considered three sources of vibration together: the handlebars, footrests, and the seat.
Subjective assessment – what do you feel?
To start with, 217 people (6% female and 94% male) answered a questionnaire about their experiences of motorbike vibrations.
Overall, people reported that vibrations were particularly noticeable when driving on the motorway.
The results indicate:
- 83% of riders experienced some physical effects related to motorbike vibration
- 12% of riders experienced circulation problems
- Approximately 2/3 of riders reported that vibration was not at all (or only slightly) problematic, despite reporting physical effects
Collecting data while riding
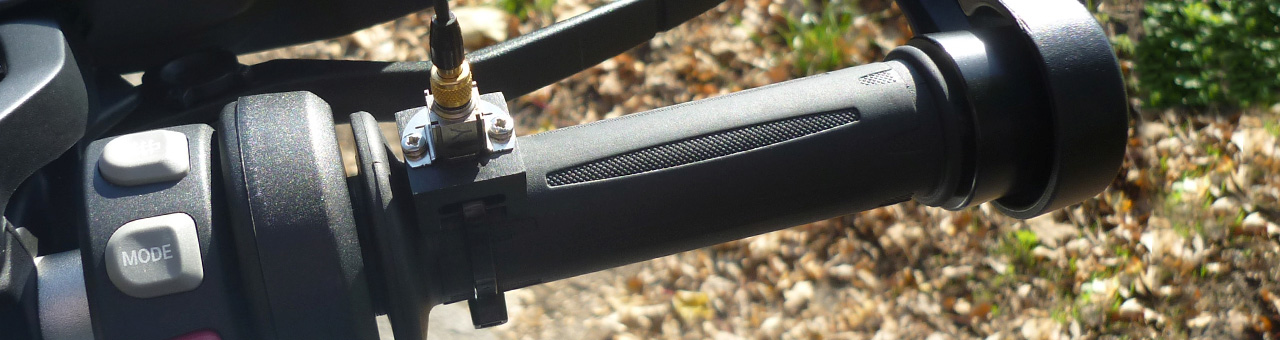
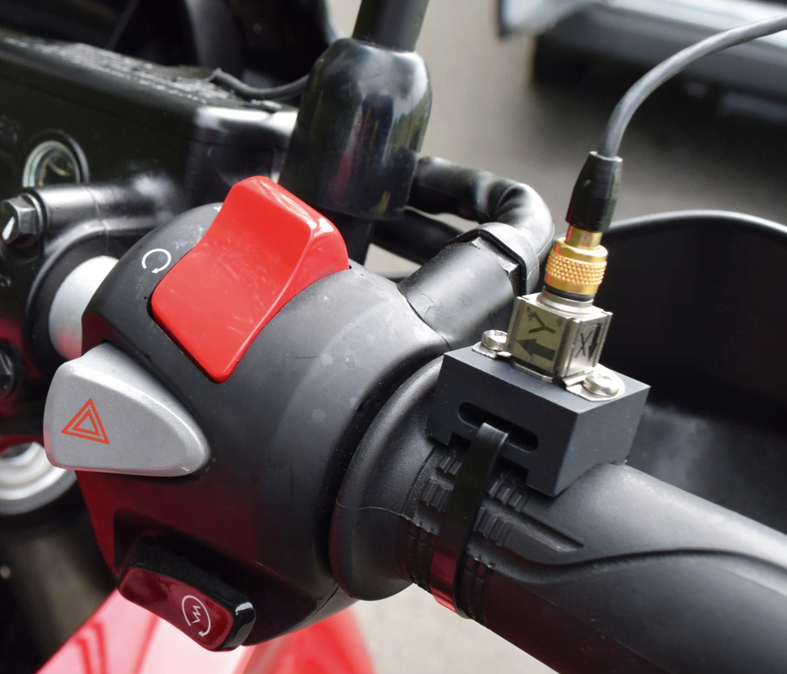
ACCELEROMETER SENSORS
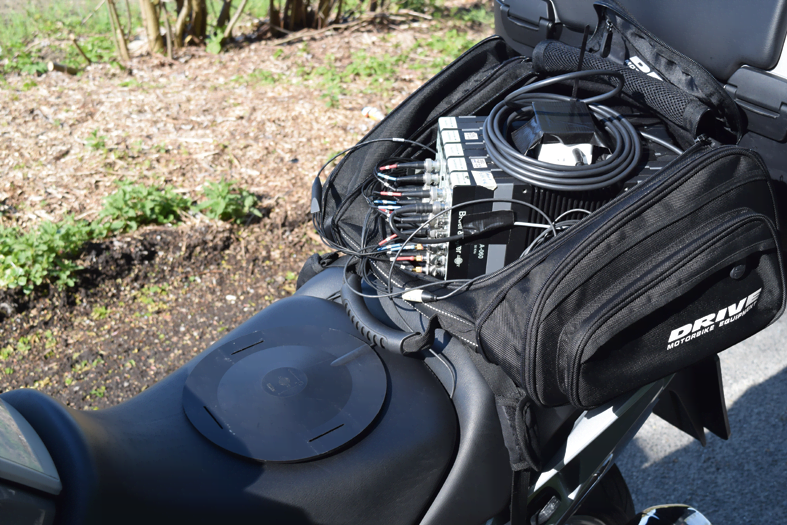
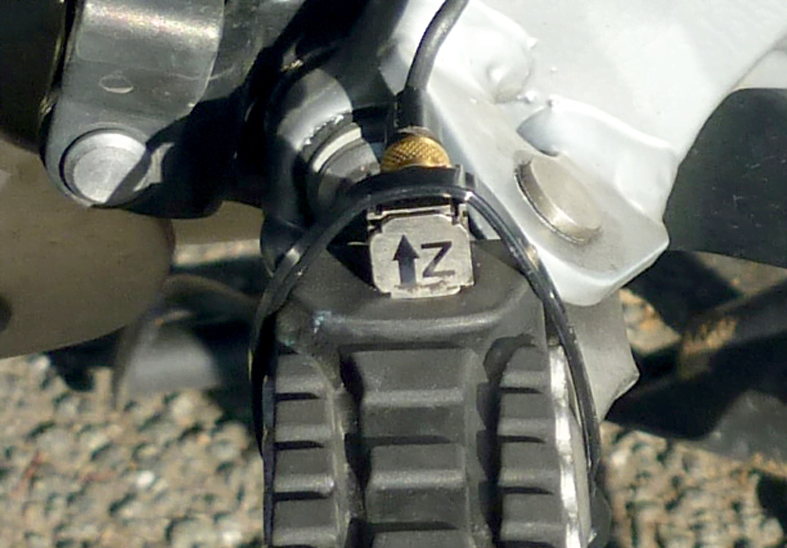
All the measurements for the riding assessment part of the study were gathered using a stand-alone recorder (Brüel & Kjær LAN-XI NOTAR) and Brüel & Kjær triaxial accelerometers mounted on both handles, both footrests, and one on the seat. In addition, the velocity was recorded using GPS technology.
The footrests varied significantly in design from each other. Measurements were done on pedals or platforms, which were different shapes, depending on the motorbike model. Different types of accelerometers were used, depending on whether the footrest had a rubber surface, and the mounting was done with or without an adapter. In one case, a magnet adapter was used. Data were recorded using the LAN-XI with a mobile power supply installed on the driver’s seat in a seat-bag. Finally, data analysis was carried out using Brüel & Kjær’s PULSE Reflex™
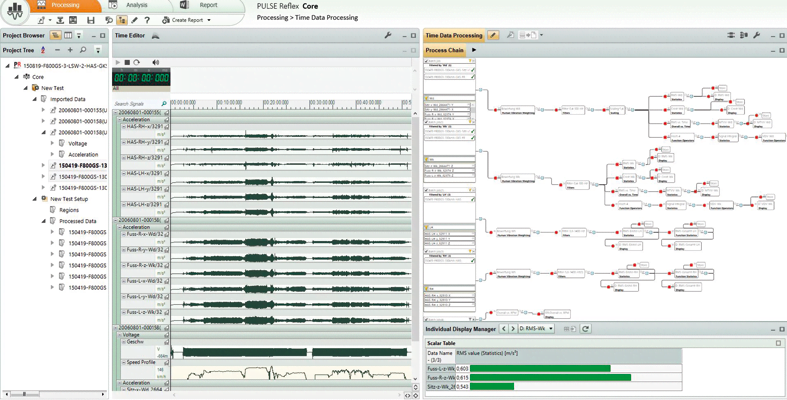
Analysis with PULSE Reflex™: Time data with acceleration-signals and speed profile on the left and process chain with part of the result table on the right
Testing different conditions
Each motorbike drove approximately 40 km with data recording in progress. In total, 2500 km was driven on 27 bikes including test runs and endurance tests to gather all the measurements. Vibration data was measured over a 5 to 10 minute period for each of the following different conditions:• At a constant speed of 50 km/h• At a constant speed of 90 km/h • At a constant speed of 130 km/h • Driving on a winding country road with varying speed, acceleration, and braking
The road surface was considered ’good’ on the constant speed driving routes and ’good to medium’ on the country road.
Evaluation
Vibration at the handlebars was filtered (frequency range 6.3 to 1250 Hz) and then the vibrations of the three measured translational directions (x, y, and z) were combined to form a total value. The total value was then given frequency-dependent evaluation factors, which map the sensitivity of the hand-arm system to different frequencies. The frequency-evaluated total vibration value was then used for assessment.
For whole-body vibrations (at the footrests and in the seat), the filtering was in the frequency range from 0.8 to 80 Hz. The oscillation direction (x, y, or z) with the highest value was then evaluated. For motorbike oscillations, it is always the z-direction (perpendicular to the road surface) that has the highest oscillation value, so only this was used in the evaluations.
Individual rider influences
For a given motorbike model, the individual rider can significantly influence the actual vibration exposure through their driving pattern.
To determine the influence, measurements were carried out with three different drivers (Driver 1: 183 cm, 95 kg; Driver 2: 177 cm, 67 kg; Driver 3: 183 cm, 70 kg) on the same day, on the same bike (BMW F800GS, 2012) and on the same test route. All sensors remained mounted between the test drives, to exclude mounting related variations.
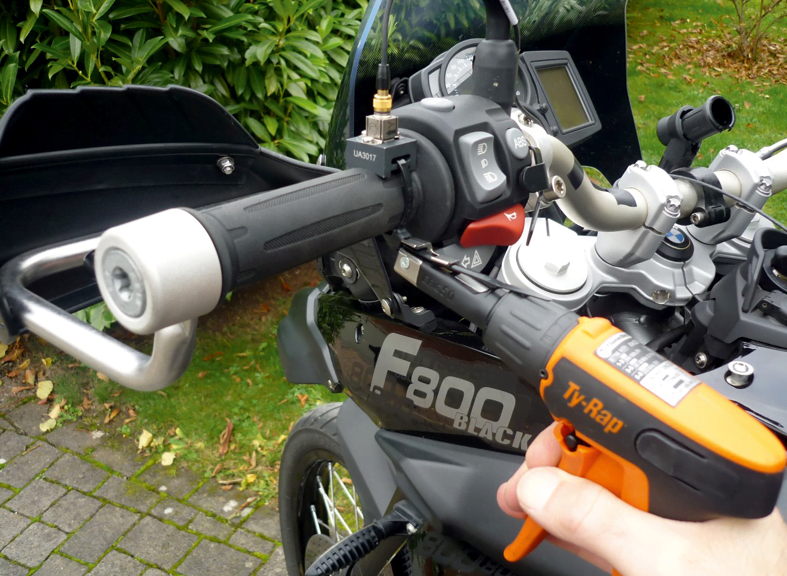
To ensure the reproducibility of the measurements, the accelerometers were mounted with cable straps and a tool to tighten the straps with always the same force
It was found that differences between riders could be attributed to different driving styles (choice of gear, the intensity of acceleration and deceleration), the choice of ’line’ (resulting in contact with the different road surface), and seat posture (different grip and self-stabilization). The study indicates that each driver literally has it ’in his or her hands’ to influence the magnitude of vibration exposure (for a given motor-bike).
The measurements also indicate that vibration depends on the age of the bike (older ones lead to stronger vibrations than newer ones) and the number of cylinders (for example, vibrations of single-cylinder bikes exceed those of four cylinders). In contrast, the driver’s weight and driver’s experience seem to have little or no significance.
Exceeding vibration exposure limits
In this study, the exposure limits of the EU Directive were reached and, in some cases, clearly exceeded* (with regard to an exposure time of 8 hours per day, see ‘EU directive’ box).
All measurements indicate a significant variation depending on the bike model. In general, values increase with increased speed. In the case of hand-arm vibrations, the 8-hour action value of 2.5 m/s2 was (depending on driving mode) exceeded by all makes of bike, but also the limit value of 5 m/s2 was exceeded by a number of bikes.
For whole-body vibrations, the magnitude of vibrations increases with increased velocity and the vibration at the footrests exceed those on the seat. The action value of 0.5 m/s2 was exceeded by all vehicles (depending on the driving mode). When driving under varied modes (cross country, cornering, braking, and accelerating) even the limit value of 0.8 m/s2 was exceeded in z-directions for almost all measurements.
For the investigated vehicles in the police service, both the hand-arm and whole-body vibration values were exceeded, but the limit values were not. However, the St. John’s service riders did not exceed the values.
Conclusions
Professor Adamek concludes that bikers are exposed to excessive vibrations and many report effects on their body. However, most do not perceive these vibrations as troubling. Measurements of human vibrations for motorbike riders clearly exceed the recommended limits, and whole-body vibrations exceeded the limits more than hand-arm vibrations*. For a given bike model, the individual driver can significantly influence the actual vibration exposure through their driving style and seat posture.* To inform various groups of riders about the vibration exposure risk, the results from this study can be accessed on the project homepage: Motorrad-Humanschwingungen
The research in numbers
27 different motorbikes:• Engine: 1, 2 and 4 cylinders• Displacement: 300 to 1340 cm³• Power: 20 to 142 kW (27 to 193 hp)• Year of manufacture: 1967 to 2014
23 drivers (2 female, 21 male):• Age: 20 to 66 years• Height: 165 to 193 cm• Weight: 60 to 110 kg
Total driving distance with data recording: 2500 km
EU Directive on Vibration (2002)
The Directive aims to ensure the health and safety of people exposed to vibration. It distinguishes between hand-arm vibration and whole-body vibration and defines the following exposure limit values (standardized to an 8-hour reference period):
Hand-arm vibration• Exposure limit value = 5 m/s2• Exposure action value = 2.5 m/s2
Whole-body vibration• Exposure limit value = 1.15 m/s2 (x,y); 0.8 m/s2 (z-direction)• Exposure action value = 0.5 m/s2
RELATED PRODUCTS
RELATED ARTICLES
当社ニュースレターを購読すると音とバイブレーションの世界からの最新情報を取得できます。
最新のブリュエル・ケアーからのニュースをメールでお届けします。
新製品情報、セールやキャンペーンなどの情報
音響・振動の記事、ビデオや情報