CONTENT
Single, wide frequency band vibration measurements are a useful quick-look vibration indicator, which can be used for example when evaluating the general condition of a machine or the effectiveness of vibration isolation measures.
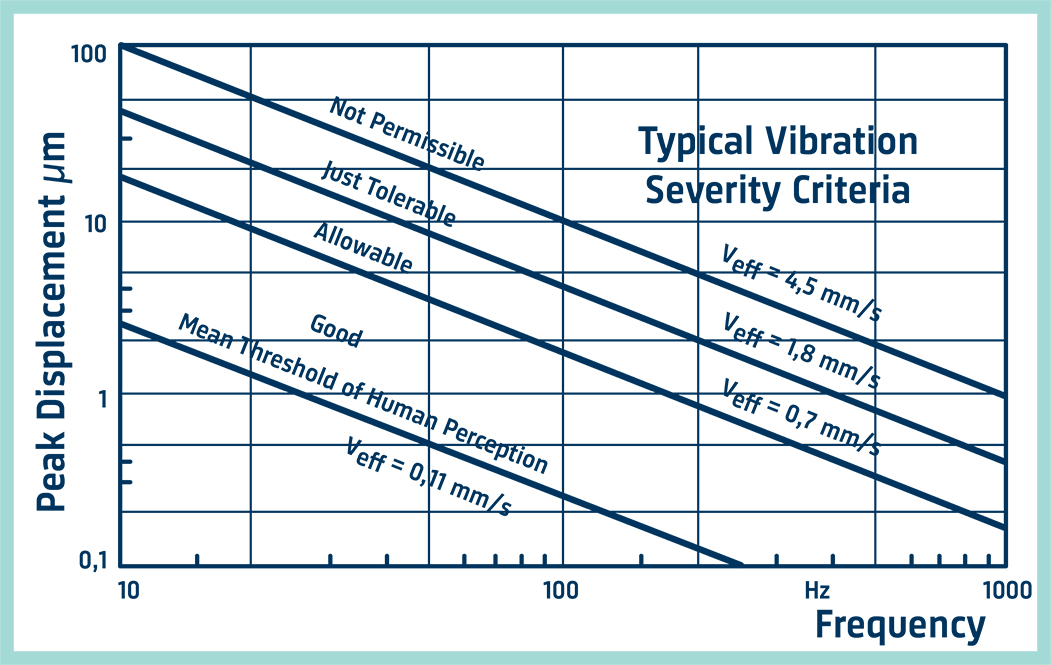
The actual level measured will be judged more or less severe by comparison with previously or subsequently measured levels or with published severity criteria. An example of the latter is shown in the drawing, extracted from standards and recommendations for judging the vibration severity of rotating machinery. (ISO 20816-1)
For diagnostic purposes, for example in the course of product development, frequency analysis is necessary. Some frequency components in the vibration frequency spectrum can be immediately related to particular forcing functions, for example, shaft rotation speeds, gear tooth meshing frequencies, etc.
We will almost always find additional significant frequency components in the spectrum which are also related to the fundamental motions. The most significant is usually harmonics (a multiple) of one of the fundamental frequencies. Harmonics often arise because of distortion of the fundamental frequencies or because the original periodic motion is not purely sinusoidal. If they coincide with the resonant frequencies of other machine elements, then possibly considerable vibration levels can result, which can become a major noise source or result in the transmission of high forces to other machine parts.
With gear wheels, tooth form deflection under load and tooth wear will give rise to a tooth meshing frequency component and harmonics.
Furthermore, sideband components are often generated around the tooth meshing frequency and harmonics, due to periodic variations such as eccentricity. The first upper and lower sidebands will appear at the tooth mesh frequency (ft) plus and minus the gear rotation frequency (fg), the second sidebands at ft ± 2fg, and so on. Around the tooth mesh harmonics, a similar pattern may be present (i.e. 2ft ±fg, etc.)
It is often impracticable to alter forcing frequencies (shaft speeds, gear ratios, etc.) so other methods of reducing undesirable vibration levels are used. For example. detuning the machine element (altering its resonant frequency) by changing its mass or stiffness; by attenuating the transmission of vibration with isolation materials, or by adding damping materials to reduce the vibration amplitude.
Vibration as a Machine Condition Indicator
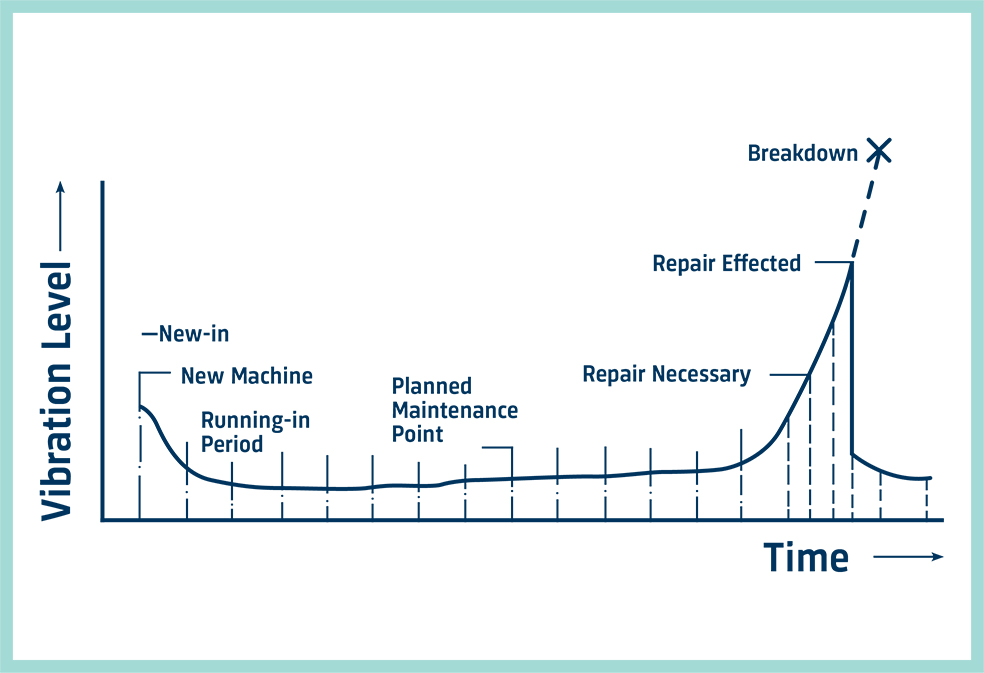
Machines seldom break down without warning, the signs of impending failure are usually present long before breakdown makes the machine unusable. Machine troubles are almost always characterized by an increase in vibration level which can be measured on some external surface of the machine and thus act as an indicator. The bathtub curve shown is a typical plot of vibration level against time that demonstrates this effect. With normal preventive maintenance, repairs are carried out at fixed intervals based on minimum life expectancy for wearing parts. By delaying repair until vibration levels indicate the need, but before a breakdown, unnecessary strip-down (which often promotes further faults) and production delays are avoided.
This "on condition" maintenance of machinery has proven to give an appreciable economic advantage by increasing the mean time between shutdown while still preventing the surprise and damaging effects of catastrophic failure during service. These techniques are now widely used especially in the continuous process industries.
The vibration level which may be allowed before undertaking a repair is best determined through experience. At present, the general opinion suggests that the "action level" should be set at two to three times (6 to 10 dB above) the vibration level considered normal.
We have already seen that with frequency analysis of vibration signals we can locate the source of many of the frequency components present. The frequency spectrum of a machine in a normal running condition can therefore be used as a reference "signature" for that machine. Subsequent analyses can be compared to this reference so that not only the need for action is indicated but also the source of the fault is diagnosed.
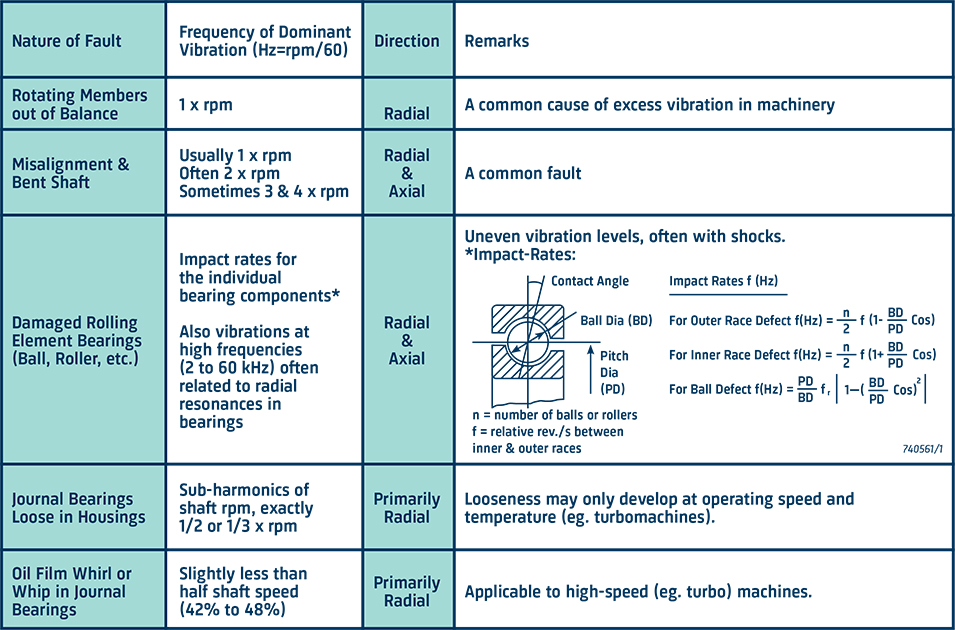
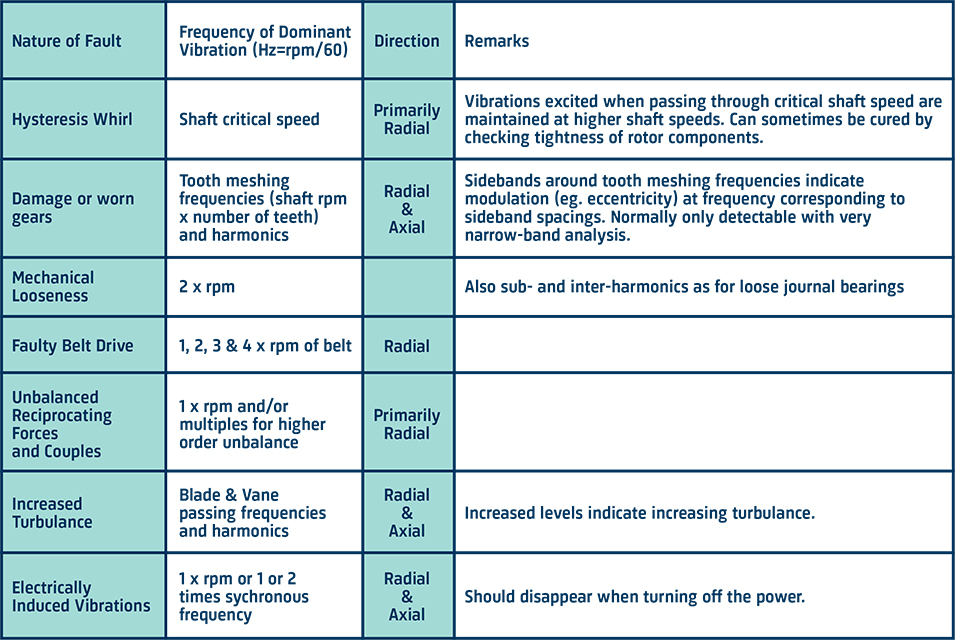
The diagnostic chart on the following two pages will help isolate the cause of excess vibration when the offending frequencies can be discovered through frequency analysis.