In this article, we will explore one possible application where Hand-held Analyzer Type 2250 is combined with a BK Connect applet for post-processing periodic tests of rotating machinery. Type 2250 is used as a highly portable solution for measurements in the field with simple pass/fail indications, backed up with BK Connect’s Order Post-analysis Applet Type 8490-G for more detailed analysis of failed tests.
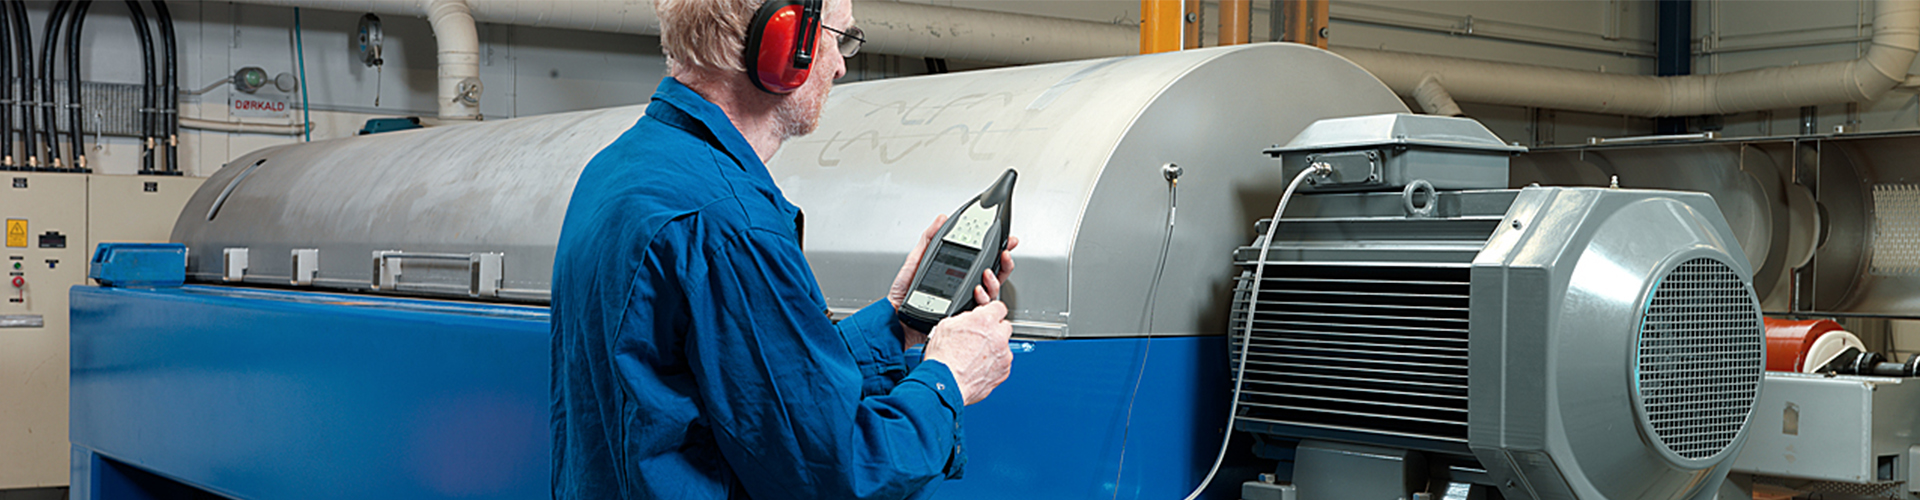
Vibration measurement is commonly used for condition monitoring of rotating machinery. In large installations, permanent and continuous monitoring is commonly used, but in situations where the machinery is widely distributed geographically, or is mobile, periodic vibration measurements with a hand-held vibration analyzer can be more practical. Type 2250 is ideally suited to this application, for testing almost any rotating machine, from a desktop fan through to a helicopter engine.
With the BZ-7230 FFT Analysis module, Type 2250 can be configured for simple pass or fail measurements of rotating machinery during a run-up test. Several tolerance windows can be defined, each specifying level criteria in a particular frequency range, which can be used to effectively set criteria for vibration at different machine speeds during the run-up test. Once tolerance windows have been configured for a specific machine and test, the complete setup can be saved as a template and password protected. The resulting template can be safely shared with technicians for field testing, giving unambiguous test results without the need for specialist sound and vibration test knowledge.
A run-up test with Type 2250 as described above, gives a pass or fail result quickly and simply, but it doesn’t provide very much diagnostic power. In situations where a machine exceeds the limits in one or more tolerance windows, additional analysis with the BK Connect Order Post-analysis Applet can help reveal the cause of the exceedance, informing future actions.
So that we can analyze our measurements in BK Connect, we need to enable signal recording on Type 2250. With Signal Recording Option BZ-7226, Type 2250 can be configured to record the entire measurement as a 24-bit, 48 kHz wave file. The CCLD Laser Tacho Probe Type 2981 can also be connected to Type 2250 to add RPM to the measurement, displayed in real-time and automatically encoded into the wave file for post-processing. With these additions, order analysis can now be performed on the measurements in BK Connect.
But why should we perform order analysis? Order analysis relates the measurement to the revolutions, rotational speed and harmonic orders of the rotating parts in the machine being tested. Mechanical systems with rotating elements will experience periodic excitation forces with a fundamental frequency following the rotation frequency. These excitation forces give rise to corresponding periodic response signals, that is, signals having content at the fundamental (rotational) frequency and its harmonics. Order analysis techniques allow us to extract these harmonic orders from the response signals, giving us additional insight into the causes of noise and vibration phenomena in the system under test.
The BK Connect Order Post-analysis Applet Type 8490-G includes templates for both order extraction from FFT analysis and digitally resampled order tracking analysis. Each of these techniques are summarized below, along with some of their key advantages and disadvantages. Of course, the same measurement can be analyzed in BK Connect with both techniques separately, so there is no need to choose which technique to use at the time of measurement.
An order extraction from FFT analysis or a run-up measurement reveals the relationship between frequency spectra and RPM. In this analysis, a multi-buffer of FFT frequency spectra is calculated for each speed interval (calculated from the tachometer signal). Since the spectra are still presented in terms of frequency, this analysis has the benefit of familiarity for users coming from simple frequency analysis, and prominent features in the measurement can more easily be related back to audible phenomena. Constant frequency components such as structural resonances can easily be identified on a contour plot, manifesting as vertical lines at fixed frequencies. But since each spectrum slice represents a range of speeds, frequency smearing of the order components can make it difficult to separate higher orders, particularly for fast sweep rates in the run-up.
In an order tracking analysis, the measurement signal is resampled according to the rotational speed of the machine using the tachometer signal, such that there is a constant number of samples per revolution. The Fourier transform of the resampled signal gives the order spectrum, with an x-axis in harmonic orders related to the fundamental rotational rate of the system rather than frequency in Hertz. On a contour plot, the orders and interharmonic components appear as clear vertical lines, and constant frequency components such as structural resonances follow hyperbolic curves on the contour plot. The order components are no longer smeared, making higher harmonic orders identifiable. Combined with a knowledge of the system under test, such as the number of blades in a fan or teeth in a gear, this analysis can also provide insights about the relationships between system parts and order components, aiding fault diagnosis.
This article only scratches the surface of theory and applications of order analysis and order tracking, and the possibilities of post-processing analysis in BK Connect to increase the diagnostic power of vibration measurements made with Type 2250. Similar benefits can be found by combining hand-held measurements on Type 2250 or Type 2270 with other BK Connect applets, all while maintaining the simplicity and portability of the hand-held analyzer for measurement in the field.
Analysis techniques allow us to extract these harmonic orders from the response signals, giving us additional insight into the causes of noise and vibration phenomena in the system under test.
The BK Connect Order Post-analysis Applet Type 8490-G includes templates for both order extraction from FFT analysis and digitally resampled order tracking analysis. Each of these techniques are summarized below, along with some of their key advantages and disadvantages. Of course, the same measurement can be analyzed in BK Connect with both techniques separately, so there is no need to choose which technique to use at the time of measurement.
An order extraction from FFT analysis or a run-up measurement reveals the relationship between frequency spectra and RPM. In this analysis, a multi-buffer of FFT frequency spectra is calculated for each speed interval (calculated from the tachometer signal). Since the spectra are still presented in terms of frequency, this analysis has the benefit of familiarity for users coming from simple frequency analysis, and prominent features in the measurement can more easily be related back to audible phenomena. Constant frequency components such as structural resonances can easily be identified on a contour plot, manifesting as vertical lines at fixed frequencies. But since each spectrum slice represents a range of speeds, frequency smearing of the order components can make it difficult to separate higher orders, particularly for fast sweep rates in the run-up.
In an order tracking analysis, the measurement signal is resampled according to the rotational speed of the machine using the tachometer signal, such that there is a constant number of samples per revolution. The Fourier transform of the resampled signal gives the order spectrum, with an x-axis in harmonic orders related to the fundamental rotational rate of the system rather than frequency in Hertz. On a contour plot, the orders and interharmonic components appear as clear vertical lines, and constant frequency components such as structural resonances follow hyperbolic curves on the contour plot. The order components are no longer smeared, making higher harmonic orders identifiable. Combined with a knowledge of the system under test, such as the number of blades in a fan or teeth in a gear, this analysis can also provide insights about the relationships between system parts and order components, aiding fault diagnosis.
This article only scratches the surface of theory and applications of order analysis and order tracking, and the possibilities of post-processing analysis in BK Connect to increase the diagnostic power of vibration measurements made with Type 2250. Similar benefits can be found by combining hand-held measurements on Type 2250 or Type 2270 with other BK Connect applets, all while maintaining the simplicity and portability of the hand-held analyzer for measurement in the field.