
Efficiency With Result Matrix and Data Table Viewer
As part of the BK Connect® 2020.0 release last November, the Result Matrix and Data Table Viewer tasks are now included as standard features in the Data Processing application making it faster and easier to get an overview of all your data, make comparisons and generate your final report.
BK Connect Data ManagerOver the past few newsletters, we have discussed a lot about the value of your data. We have shown how using metadata to document your data adds value to the entire organization. It is not only valuable for finding the specific data you are looking for but also for annotating the display legends in your report. We have also seen the search utilities in the Team Server based on the metadata added to the time recordings or processed results that can be produced by BK Connect. This is important because we spend most of our time sifting through data. It is only when we start to sift through data that problems are solved, and lessons learnt.
That is where the Result Matrix and Data Table Viewer tasks come in.
As part of the BK Connect 2020.0 release last November, these two tasks are now included as standard features in the Data Processing application making it faster and easier to get an overview of all your data, make comparisons and generate your final report.
Result Matrix
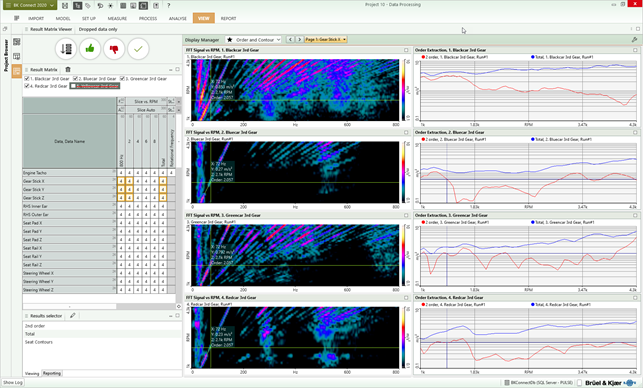
Using the Result Matrix allows you to have this high-level overview of the results available as the rows show the channel name, and the columns are segmented by processing type. Selecting any cell or cells in the matrix populates data into the displays. Then by selecting some of the predefined or user definable rules, the way in which the data is sorted into the displays can be controlled. The rule can be anything from each result in its own display to all the results overlaid in a single display.
Data Table Viewer
If you prefer to use a table to sort and organize your data, that’s not a problem. While the Result Matrix gives a condensed overview, the Data Table Viewer provides a tabular view of all results, which can be sorted and filtered to find and compare the data you need. The Data Table and Result Matrix Viewers share the display favourites and a common reporting approach. This flexibility provides a powerful and flexible environment for your data discovery. The access you have to all these results not only reduces the amount of time spent making comparisons but also increases the knowledge you have in the data simply because it is so easy to make just one more comparison. This functionality is fundamental to BK Connect and fundamental to the way in which sound and vibration engineers work every day.
Subscribe to our newsletter and receive the latest stories from our world of sound and vibration
The latest news from Brüel & Kjær delivered to your inbox
New product releases, discounts and special offers
Sound and vibration articles, videos and guides